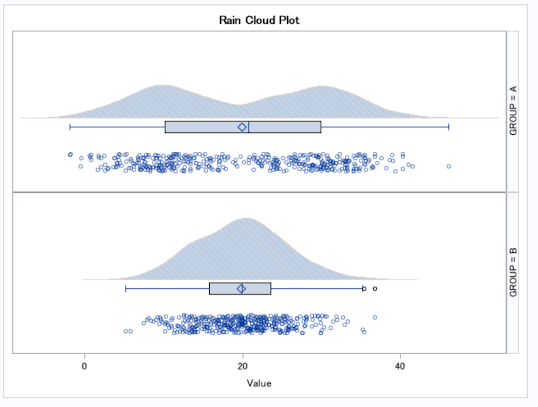
多群で経時反復測定のデータをどのように視覚的に把握するかという点においても
Raincloud plotはよいと思われます.梅雨時なので季節にもあってます
前回のコードからの改良として
パネル分割をやめて,1枚にして,それにともなって
BOXPARAMをBOXにして,事前計算を省略.さらにグラフ間の位置取りの調整も
基本的にtemplate内のevalにつっこんで,データステップでは,各時点間のスペースの具合を調整する用のところのみ残した
%let outpath=XXXX;/*Test dataset*/
data test;
call streaminit(1080);
do Timepoint=1 to 5;
GROUP="A";
do id=1 to 400;
select(timepoint);
when(1) val=rand("normal",30,5);
when(2) val=rand("normal",33,4);
when(3) val=rand("normal",35,5);
when(4) val=rand("normal",34,6);
when(5) val=rand("normal",34,4);
end;
output;
end;
GROUP="B";
do id=1 to 400;
select(timepoint);
when(1) val=rand("normal",18,5);
when(2) val=rand("normal",20,4);
when(3) val=rand("normal",22,5);
when(4) val=rand("normal",24,5);
when(5) val=rand("normal",21,3.5);
end;
output;
end;
GROUP="C";
do id=1 to 400;
select(timepoint);
when(1) val=rand("normal",40,3);
when(2) val=rand("normal",39,4);
when(3) val=rand("normal",42,5);
when(4) val=rand("normal",41,5);
when(5) val=rand("normal",41,3.5);
end;
output;
end;
end;
run;
/* calculation----kernel density estimation*/
proc kde data = test ;
univar val /out=kde ;
by TimePoint GROUP;
run;
/*dataset-fix*/
data wk2;
set kde(in=ina)
test(in=inb)
;
by Timepoint ;
retain timecount 0;
if first.Timepoint then timecount+0.3;
run;
/*Plot-define*/
ods graphics on /imagemap=on tipmax=1000000 ANTIALIASMAX=1000000;
ods html path="&outpath" file="test.html";
proc template ;
define statgraph RCP ;
begingraph;
layout overlay
/ yaxisopts = (display=none offsetmin=0.03 offsetmax=0.03 ) ;
bandplot x=value limitupper=eval(density-timecount) limitlower=eval(0-timecount)
/ group=GROUP fillattrs=(transparency=0.4) tip=none;
boxplot y = val x = eval(-0.03-timecount)
/ orient = horizontal group=GROUP groupdisplay=cluster clusterwidth=0.2
fillattrs=(transparency=0.4) connect=mean display=(caps fill mean median outliers notches connect)
boxwidth = 1;
scatterplot x=val y=eval(-0.12 + 0.05*cdf('NORMAL', rannor(1234)) + coalesce(0, val)-timecount)
/ group=group jitter=auto jitteropts=(axis=Y width=1) markerattrs=(symbol=circle size=5 transparency=0.4)
rolename=(tip1=ID tip2=VAL tip3=GROUP)
tip=(tip1 tip2 tip3)
tiplabel=(tip1="ID" tip2="Value" tip3="GROUP")
;
endlayout;
endgraph;
end;
run;
/*Plot-submit*/
proc sgrender data=wk2 template=RCP ;
run;
ods html close;


