MathMLを勉強しているのだけども…

いつも、一応ブログに書くことは、そこそこ、自分で理解してて、そんなに大きな間違いはなかろうってことを書くようにしてるのですが…、今回はちょっと自信なし。むしろ教えてって内容です

MathML(Mathematical Markup Language)に興味をもっていて、EPUB形式の中に統計解析の数式を埋め込むことで、SASと統計解析の電子書籍のテキストが作れないかなぁとか思って、ちみちみ勉強してるのですが、 MathMLの実装がよくわからなくて大苦戦中…
辛いのが、不可解な現象が起きた時に、それがEPUBリーダー起因なのか、私のMathMLの理解不足起因なのか、実装してるSASの問題なのかよくわからないという点

↓Firefoxのepubリーダーアドイン
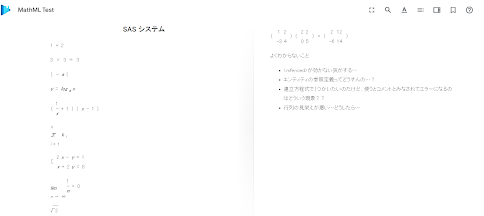


↓Google Play books


そもそも、iPadもKindleも持ってないのに、EPUBとかやってんじゃねえよって話ですが(笑)

ods epub file="XXXX\test.epub" title="MathML Test";

ods escapechar='^';

proc odstext contents="";


p '^{mathml <math xmlns="http://www.w3.org/1998/Math/MathML">

  <mn>1</mn>

  <mo>+</mo>

  <mn>2</mn>

  </math>}';


p '^{mathml <math xmlns="http://www.w3.org/1998/Math/MathML">

  <mn>3</mn>

  <mo>&#xD7;</mo>

  <mn>3</mn>

  <mo>&#xF7;</mo>

  <mn>3</mn>

</math>}';


p '^{mathml <math xmlns="http://www.w3.org/1998/Math/MathML">

  <mo>|</mo>

  <mrow>

    <mo>-</mo>

    <mi>a</mi>

  </mrow>

  <mo>|</mo>

</math>}';


p '^{mathml <math xmlns="http://www.w3.org/1998/Math/MathML">

  <mi>y</mi>

  <mo>=</mo>

  <msub>

    <mi>log</mi>

    <mi>a</mi>

  </msub>

  <mi>x</mi>

</math>}';


p '^{mathml <math xmlns="http://www.w3.org/1998/Math/MathML">

 <mrow>

    <mo>(</mo>

    <mfrac>

      <mn>1</mn>

      <mi>x</mi>

    </mfrac>

    <mo>+</mo>

    <mn>1</mn>

    <mo>)</mo>

  </mrow>

  <mrow>

    <mo>(</mo>

    <mi>x</mi>

    <mo>-</mo>

    <mn>1</mn>

    <mo>)</mo>

  </mrow>

</math>}';


p '^{mathml <math xmlns="http://www.w3.org/1998/Math/MathML">

  <munderover>

    <mi>&#x2211;</mi>

    <mrow>

      <mi>i</mi>

      <mo>=</mo>

      <mn>1</mn>

    </mrow>

    <mi>n</mi>

  </munderover>

  <msub>

    <mi>k</mi>

    <mi>i</mi>

  </msub>

</math>}';


p '^{mathml <math xmlns="http://www.w3.org/1998/Math/MathML">

  <mo>[</mo>

  <mtable>

    <mtr>

      <mtd>

        <mn>2</mn>

        <mi>x</mi>

        <mo>-</mo>

        <mi>y</mi>

        <mo>=</mo>

        <mn>1</mn>

      </mtd>

    </mtr>

    <mtr>

      <mtd>

        <mi>x</mi>

        <mo>+</mo>

        <mn>2</mn>

        <mi>y</mi>

        <mo>=</mo>

        <mn>8</mn>

      </mtd>

    </mtr>

  </mtable>

</math>}';


p '^{mathml <math xmlns="http://www.w3.org/1998/Math/MathML">

  <munder>

    <mi>lim</mi>

    <mrow>

      <mi>n</mi>

      <mo>&#x2192;</mo>

      <mi>∞</mi>

    </mrow>

  </munder>

  <mfrac>

    <mn>1</mn>

    <mi>n</mi>

  </mfrac>

  <mo>=</mo>

  <mn>0</mn>

</math>}';


p '^{mathml <math xmlns="http://www.w3.org/1998/Math/MathML">

  <msqrt>

    <mn>2</mn>

  </msqrt>

</math>}';


p '^{mathml <math xmlns="http://www.w3.org/1998/Math/MathML">

<math>

    <mo>(</mo>

    <mtable>

      <mtr>

        <mtd>

          <mn>1</mn>

        </mtd>

        <mtd>

          <mn>2</mn>

        </mtd>

      </mtr>

      <mtr>

        <mtd>

          <mn>-3</mn>

        </mtd>

        <mtd>

          <mn>4</mn>

        </mtd>

      </mtr>

    </mtable>

    <mo>)</mo>

    <mo>(</mo>

    <mtable>

      <mtr>

        <mtd>

          <mn>2</mn>

        </mtd>

        <mtd>

          <mn>2</mn>

        </mtd>

      </mtr>

      <mtr>

        <mtd>

          <mn>0</mn>

        </mtd>

        <mtd>

          <mn>5</mn>

        </mtd>

      </mtr>

    </mtable>

    <mo>)</mo>

  <mo>=</mo>

    <mo>(</mo>

    <mtable>

      <mtr>

        <mtd>

          <mn>2</mn>

        </mtd>

        <mtd>

          <mn>12</mn>

        </mtd>

      </mtr>

      <mtr>

        <mtd>

          <mn>-6</mn>

        </mtd>

        <mtd>

          <mn>14</mn>

        </mtd>

      </mtr>

    </mtable>

    <mo>)</mo>

</math>

</math>}';


p"よくわからないこと";

   list;

      item "<mfenced>が効かない気がする…";

      item "エンティティの参照定義ってどうすんの…?";

      item "連立方程式で{つかいたいのだけど、使うとコメントとみなされてエラーになるのはどういう現象??";

  item "行列の見栄えが悪い…どうしたら…";

    end;


run;


ods epub close;


2変量データに対しての3D Raincloud plot[アニメーションバージョン]

前使ったダミーデータを雑にずらして二峰性にしたのでなんか、ラクダのコブか、戦艦みたいになっちゃいました


3Dグラフの、視点角度をループでずらして何枚も作図しながらanimationでまとめてGIFファイルにしてみました
なんか微妙に縮尺がブレて、ん?みたいになるので、ほんとはなんか調整がいるのかも
底面に配置したのはHPBINプロシジャでの単純なQuantile Binningの10ビンバージョンです
ようするに各変量で、ただ10%ごとに分位点だしてそれでメッシュしただけっす。
2変量に対しての3次元RCPがプロットとして有用かどうかは、ちょっと私自身、まだ実装例がないので、ちょっと保留で。散布図とヒートマップ、BAGPLOTなど2次元のプロットで複合評価するほうが正確に把握できる気もしている… 身も蓋もないけど(笑)

data wk1;

 seed = 15678;

 do i = 1 to 500;

  z1 = rannor(seed);

  z2 = rannor(seed);

  z3 = rannor(seed);

  x = 3*z1 + z2;

  y = 3*z1 + z3;

  output;

 end;

 do i = 1 to 500;

  z1 = rannor(seed)+3;

  z2 = rannor(seed)+3;

  z3 = rannor(seed)+3;

  x = 3*z1 + z2;

  y = 3*z1 + z3;

  output;

 end;

 drop seed;

run;

proc kde data=wk1 ; 

   bivar x y/ out=kde; 

run;

data wk2;

set wk1(in=wk) kde(in=kde);

if wk then do;

    density2=ranuni(777)*0.004;

end;

if kde then do;

    x=value1;

    y=value2;

    if density>10**-5 then density2=density+0.01;

    else delete;

end;

keep x y density2;

run;


ods output Mapping=map;

proc hpbin data=wk1  numbin=10 quantile   ;

   input x y;

 run;

data anno2;

set map;

where same ^missing(LB);

if  variable="x" then do;

   function='move'; xsys='1';ysys='2';zsys='2';color="gray";line=2;size=0.1; x=0; y=LB; z=0;output;

   function='draw';   x=100; y=LB; z=0;output;

end;

if  variable="y" then do;

   function='move'; xsys='2';ysys='1';zsys='2';color="gray";line=2;size=0.1; x=LB; y=0; z=0;output;

   function='draw';   x=LB; y=100; z=0;output;

end;

run;


%macro plot;

%do rotate=0  %to 360 %by 10;

goptions reset=all border cback=white htitle=12pt; 

proc g3d data=wk2;

 scatter x*y=density2 /shape="balloon" annotate=anno2  yticknum=2 xticknum=2 size=0.5 rotate=&rotate noneedle

;

run; 

%end;

%mend;

options  ANIMATION=START  ANIMDURATION=0.5   PRINTERPATH=GIF nodate;

ods printer file="xxxxx\test\test.gif" ;

%plot

ods printer close ;

options  ANIMATION=STOP ;